*Een eerdere versie van dit artikel werd voorbereid voor presentatie tijdens de jaarlijkse bijeenkomst van de International Society of Political Psychology, Parijs, Frankrijk, 9-12 juli 2008.
Oorspronkelijk gepubliceerd door het Center for Deliberative Democracy (Stanford University)
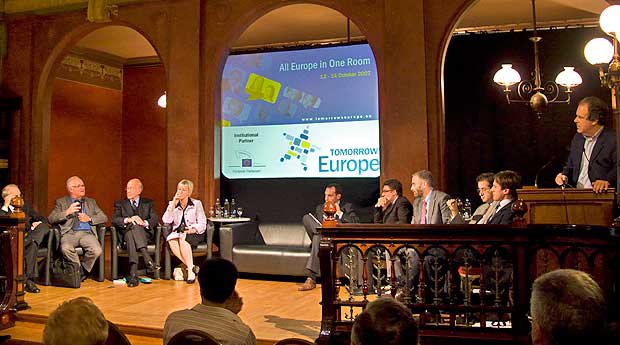
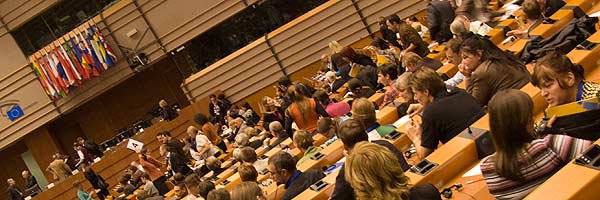
In oktober 2007 bracht de eerste EU-brede en zelfs transnationale Deliberative Poll®, Tomorrow’s Europe genaamd, een aselecte steekproef van 362 burgers uit alle 27 EU-lidstaten samen in het gebouw van het Europees Parlement in Brussel, waar ze een weekend lang beraadslaagden over uiteenlopende sociale, economische en buitenlandse beleidskwesties die de Europese Unie en haar lidstaten aangaan. Het overleg, in in totaal 23 talen, met simultaanvertaling, bestond afwisselend uit discussies in kleine groepen onder leiding van getrainde moderatoren en plenaire vraag-en-antwoordsessies met vooraanstaande beleidsexperts en prominente politici. De deelnemers werden bij het eerste contact naar hun mening gevraagd, voordat ze werden uitgenodigd voor het deliberatieweekend, opnieuw bij aankomst en tot slot aan het einde. (Voor meer over de methode en de beweegredenen, zie Fishkin 1997; Luskin, Fishkin en Jowell 2002).
Het doel was, zoals altijd bij opiniepeilingen, om in te schatten hoe het publiek over de kwesties zou denken als het er veel meer over zou denken, weten en praten en hoe dat zou verschillen van hoe het er nu over denkt (wat gewone opiniepeilingen meten). Deze opiniepeiling was echter uniek in die zin dat er een willekeurige steekproef uit alle lidstaten van de EU aan deelnam. Het publiek waarvan de meningen werden gemeten was niet dat van Duitsland, Frankrijk, het Verenigd Koninkrijk of een andere lidstaat, maar van de hele EU.
De kwesties waarover beraadslaagd werd, waren onder andere wat de EU zou moeten doen om haar pensioenstelsels te behouden, welke rol ze zou moeten spelen in de wereld, hoe ze concurrerend kan blijven in een steeds globalere economie en wat ze eventueel zou moeten doen aan het toelaten van nieuwe lidstaten. De resultaten werpen licht op de effecten van deliberatie op al deze kwesties. Ze werpen ook licht op de mogelijkheden om een Europese publieke ruimte te creëren en op de effecten van deliberatie op wederzijds respect over nationale grenzen heen.
Lees het volledige artikel
Auteurs: Robert C. Luskin (Universiteit van Texas in Austin) James S. Fishkin (Universiteit van Stanford) Stephen Boucher (Notre Europe, Parijs) Henri Monceau (Notre Europe, Parijs)
Sampling and Representativeness
The rationale of Deliberative Polling requires beginning with a sample representative of the public as it is—knowing, having thought, and having talked about the issues only as much as usual in everyday life, which in most cases is not much. In this case, the first step was parallel random sampling of all 27 member states, conducted by TNS Sofrès (the firm responsible for the Eurobarometer). We then randomly invited a subset of the 3,550 interviewees to the Deliberative Poll. Of these 362 made their way to Brussels for the weekend.
The aim was to wind up with a sample in which each country’s representation would be roughly proportional to the size of its delegation in the European Parliament. This is also roughly proportional to the country’s population, with some intentional over-representation of small countries, just as in the European Parliament itself, to ensure that they too have some voice.
Table 1 shows the distribution by country of those who showed up for the weekend. All 27 member states were in fact represented, and the percentages of the sample and of the European Parliament from given countries are indeed a very close match. In no case is the difference statistically significant. Even the match to the percentage of the EU population is close. None of these differences is statistically significant either.
But of course country is hardly the only dimension on which we should want the participants to be representative. One way of addressing the question of how well the participants represented the population of Europe is to compare them to the “nonparticipants”: the respondents to the initial survey who either were not invited or declined to attend.
Table 2 presents these results for sociodemographic variables. As can be seen, there were a fair number of statistically significant differences between the participants and the nonparticipants. Most, however, were relatively small. Somewhat more of the participants were men. Somewhat more of them were single, somewhat fewer of them widowed. Distinctly more of them were working full-time, distinctly fewer retired, slightly fewer unemployed and looking for work, somewhat more completing their education full-time, and somewhat fewer looking after the home. Perhaps the largest and most important differences, predictably, were with respect to education. Decidedly fewer of the participants had only a secondary education or less, decidedly more a university education or more. To the extent that the better educated start off knowing and having thought more about the issues, this probably makes the observed knowledge gains and attitude changes conservative.
We can also compare the participants and nonparticipants with respect to their pre- deliberation attitudes, as we do in Table 3 for four of the most relevant policy attitude indices. Here too there are some statistically significant differences, but here too they tend to be modest. As can be seen, the participants were significantly more in favor of admitting Ukraine than the nonparticipants, but neither more nor less in favor of admitting Turkey or the idea of enlargement in general. The participants were also less euro-skeptic than the non-participants on a series of ten questions asking about where decisions in given policy areas should be made, from 0 (by the individual member states) to 10 (by the EU)—rescaled in the table to 0 (EU) to 1 (individual member states). But these differences were modest. Across all 59 individual policy items we asked, not just those in these four indices, the average difference between participants and nonparticipants on these questions was only 4.0 % of the maximum it could possibly have been (given the ranges of the scales).
Initially published by the Center for Deliberative Democracy (Stanford University)


