*Une version antérieure de cet article a été préparée pour être présentée lors de la réunion annuelle de la Société internationale de psychologie politique, Paris, France, 9-12 juillet 2008.
Initialement publié par le Centre pour la démocratie délibérative (Université de Stanford)
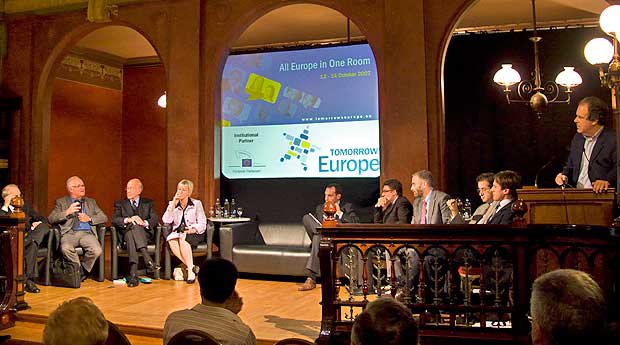
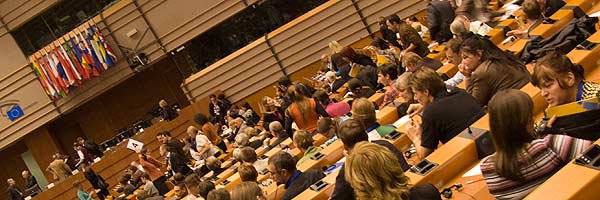
En octobre 2007, le premier sondage délibératif® à l’échelle européenne, voire transnationale, appelé Tomorrow’s Europe, a rassemblé un échantillon aléatoire de 362 citoyens des 27 États membres de l’UE dans le bâtiment du Parlement européen à Bruxelles, où ils ont passé un week-end à délibérer sur une variété de questions sociales, économiques et de politique étrangère affectant l’Union européenne et ses États membres. Les délibérations, qui se sont déroulées en 23 langues avec traduction simultanée, ont alterné entre des discussions en petits groupes dirigées par des modérateurs qualifiés et des séances plénières de questions-réponses avec d’éminents experts en politique et d’éminents hommes politiques. Les participants ont été interrogés sur leurs opinions lors du premier contact, avant d’être invités au week-end de délibération, puis à nouveau à l’arrivée, et enfin à la fin. (Pour plus d’informations sur la méthode et sa justification, voir Fishkin 1997 ; Luskin, Fishkin et Jowell 2002).
L’objectif, comme toujours dans les sondages délibératifs, était d’estimer ce que le public penserait de ces questions s’il y pensait, le connaissait et en parlait beaucoup plus, et en quoi cela différerait de ce qu’il pense actuellement de ces questions (ce que les sondages ordinaires mesurent). Ce sondage délibératif était toutefois sans précédent, car il rassemblait un échantillon aléatoire de tous les États membres de l’UE. Le public dont l’opinion était mesurée n’était pas celui de l’Allemagne, de la France, du Royaume-Uni ou d’un autre État membre, mais celui de l’ensemble de l’Union européenne.
Les questions débattues portaient sur ce que l’UE devrait faire pour préserver ses systèmes de pension, sur le rôle qu’elle devrait jouer dans le monde, sur la manière dont elle peut rester compétitive dans une économie de plus en plus mondialisée, et sur ce qu’elle devrait faire, le cas échéant, pour admettre de nouveaux États membres. Les résultats mettent en lumière les effets de la délibération sur toutes ces questions. Ils mettent également en lumière les possibilités de créer une sphère publique européenne et les effets de la délibération sur le respect mutuel au-delà des frontières nationales.
Lire l’article complet
Auteurs : Robert C. Luskin (Université du Texas à Austin) James S. Fishkin (Université de Stanford) Stephen Boucher (Notre Europe, Paris) Henri Monceau (Notre Europe, Paris)
Sampling and Representativeness
The rationale of Deliberative Polling requires beginning with a sample representative of the public as it is—knowing, having thought, and having talked about the issues only as much as usual in everyday life, which in most cases is not much. In this case, the first step was parallel random sampling of all 27 member states, conducted by TNS Sofrès (the firm responsible for the Eurobarometer). We then randomly invited a subset of the 3,550 interviewees to the Deliberative Poll. Of these 362 made their way to Brussels for the weekend.
The aim was to wind up with a sample in which each country’s representation would be roughly proportional to the size of its delegation in the European Parliament. This is also roughly proportional to the country’s population, with some intentional over-representation of small countries, just as in the European Parliament itself, to ensure that they too have some voice.
Table 1 shows the distribution by country of those who showed up for the weekend. All 27 member states were in fact represented, and the percentages of the sample and of the European Parliament from given countries are indeed a very close match. In no case is the difference statistically significant. Even the match to the percentage of the EU population is close. None of these differences is statistically significant either.
But of course country is hardly the only dimension on which we should want the participants to be representative. One way of addressing the question of how well the participants represented the population of Europe is to compare them to the “nonparticipants”: the respondents to the initial survey who either were not invited or declined to attend.
Table 2 presents these results for sociodemographic variables. As can be seen, there were a fair number of statistically significant differences between the participants and the nonparticipants. Most, however, were relatively small. Somewhat more of the participants were men. Somewhat more of them were single, somewhat fewer of them widowed. Distinctly more of them were working full-time, distinctly fewer retired, slightly fewer unemployed and looking for work, somewhat more completing their education full-time, and somewhat fewer looking after the home. Perhaps the largest and most important differences, predictably, were with respect to education. Decidedly fewer of the participants had only a secondary education or less, decidedly more a university education or more. To the extent that the better educated start off knowing and having thought more about the issues, this probably makes the observed knowledge gains and attitude changes conservative.
We can also compare the participants and nonparticipants with respect to their pre- deliberation attitudes, as we do in Table 3 for four of the most relevant policy attitude indices. Here too there are some statistically significant differences, but here too they tend to be modest. As can be seen, the participants were significantly more in favor of admitting Ukraine than the nonparticipants, but neither more nor less in favor of admitting Turkey or the idea of enlargement in general. The participants were also less euro-skeptic than the non-participants on a series of ten questions asking about where decisions in given policy areas should be made, from 0 (by the individual member states) to 10 (by the EU)—rescaled in the table to 0 (EU) to 1 (individual member states). But these differences were modest. Across all 59 individual policy items we asked, not just those in these four indices, the average difference between participants and nonparticipants on these questions was only 4.0 % of the maximum it could possibly have been (given the ranges of the scales).
Initially published by the Center for Deliberative Democracy (Stanford University)


